
Conas cairt a chruthú le dáta agus am ar ais X in Excel?

In Excel, de ghnáth cuirimid cairt isteach chun cur síos níos fearr a dhéanamh ar na sonraí. Ach i gcásanna áirithe, nuair a chruthaíonn tú colún / barra / cairt líne bunaithe ar shraith dáta agus ama, féadfar ais X na cairte a thaispeáint mar atá thíos ar an scáileán. Agus san alt seo, tugaim an bealach isteach chun an dáta agus an t-am ar ais X a thaispeáint i gceart sa Chairt.
cairt doc le dáta dáta 1

Cruthaigh cairt le dáta agus am ar ais X i gceart


mboilgeog cheart gorm saighead Cruthaigh cairt le dáta agus am ar ais X i gceart

Chun an dáta agus an t-am a thaispeáint i gceart, ní gá duit ach rogha a athrú sa Ais na formáide dialóg.

1. Cliceáil ar dheis ag an ais X sa chairt, agus roghnaigh Ais na formáide ón roghchlár comhthéacs. Féach an pictiúr:
cairt doc le dáta dáta 2

2. Ansin sa Ais na formáide pána nó Ais na formáide dialóg, faoi Roghanna Ais tab, seiceáil Ais téacs rogha sa Cineál Ais alt. Féach an pictiúr:
  cairt doc le dáta dáta 4
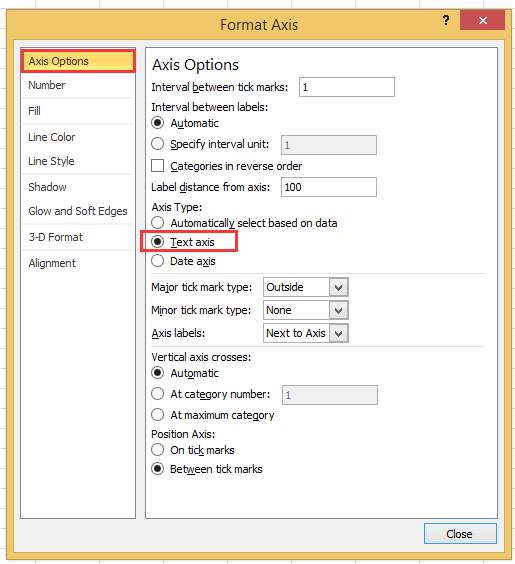
Má úsáideann tú an leagan barr feabhais níos déanaí ná 2010, is féidir leat pána Formáid Ais a fheiceáil ag dul amach, agus rogha ais Téacs a sheiceáil faoi Chineál Ais sa ghrúpa Roghanna Ais.
cairt doc le dáta dáta 3

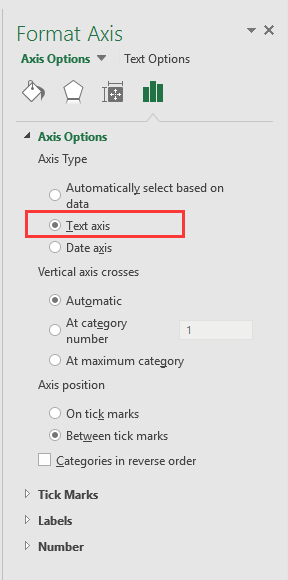
3. cliceáil Dún nó téigh ar ais chuig an gcairt, ansin ansin tá sonraí dáta agus ama curtha ar taispeáint i gceart san ais X. Féach an pictiúr:
cairt doc le dáta dáta 5


Cruthaigh cairt luasmhéadair le dhá chéim!

Uaireanta, b’fhéidir gur mhaith leat cairt luasmhéadair a úsáid chun pricessing tionscadail a thaispeáint, ach in Excel, chun cairt luasmhéadair a chruthú teastaíonn go leor céimeanna atá casta agus ag cur amú ama. Seo, an Cairt luasmhéadair is féidir le huirlis i Kutools for Excel cabhrú leat cairt luasmhéadair chaighdeánaigh a chruthú le dhá shimplí. Íoslódáil an uirlis seo le triail saor in aisce 30 lá anois.
cairt luasmhéadair doc

Uirlisí Táirgiúlachta Oifige is Fearr

🤖 Kutools AI Aide: anailís sonraí a réabhlóidiú bunaithe ar: Forghníomhú Chliste   |  Gin Cód  |  Cruthaigh Foirmlí Saincheaptha  |  Anailís a dhéanamh ar Sonraí agus Cairteacha a Ghin  |  Feidhmeanna Kutools a agairt...
Gnéithe Coitianta: Faigh, Aibhsigh nó Aithnigh Dúblaigh   |  Scrios Sraitheanna Bána   |  Comhcheangail Colúin nó Cealla gan Sonraí a Chailleadh   |   Babhta gan Foirmle ...
Cuardaigh Super: Ilchritéir VLookup    VLookup Illuachanna  |   VLookup Trasna Ilbhileoga   |   Amharc doiléir ....
Liosta anuas Casta: Go tapa Cruthaigh Liosta Anuas   |  Liosta anuas Cleithiúnach   |  Liosta Buail Isteach Ilroghnacha ....
Bainisteoir Colún: Cuir Líon Sonrach Colún leis  |  Colúin Bog  |  Scoránaigh Stádas Infheictheachta na gColún Ceilte  |  Déan comparáid idir Raonta & Colúin ...
Gnéithe Réadmhaoin: Fócas Eangaí   |  Amharc Dearaidh   |   Barra Mór na Foirmle    Leabhar Oibre & Bainisteoir Bileog   |  Leabharlann Acmhainní (Uaththéacs)   |  Piocálaí Dáta   |  Comhcheangail Bileoga Oibre   |  Criptigh/Díchriptigh Cealla    Seol Ríomhphost trí Liosta   |  Scagaire Super   |   Scagaire Speisialta (scagaire trom/iodálach/stailc tríd...) ...
Barr 15 Uirlisí12 Téacs uirlisí (Cuir Téacs, Bain Carachtair,...)   |   50 + Cairt cineálacha (Cairt Gantt,...)   |   40+ Praiticiúil Foirmlí (Ríomh aois bunaithe ar lá breithe,...)   |   19 Insertion uirlisí (Cuir isteach Cód QR, Ionsáigh Pictiúr ón gCosán,...)   |   12 Tiontú uirlisí (Uimhreacha le Focail, Comhshó Airgeadra,...)   |   7 Cumaisc & Scoilt uirlisí (Sraitheanna Comhcheangail Casta, Cealla Scoilt,...)   |   ... agus eile

Supercharge Do Scileanna Excel le Kutools le haghaidh Excel, agus Éifeachtúlacht Taithí Cosúil Ná Roimhe. Kutools le haghaidh Excel Tairiscintí Níos mó ná 300 Ardghnéithe chun Táirgiúlacht a Treisiú agus Sábháil Am.  Cliceáil anseo chun an ghné is mó a theastaíonn uait a fháil ...

Tuairisc


Tugann Tab Oifige comhéadan Tabbed chuig Office, agus Déan Do Obair i bhfad Níos Éasca

  • Cumasaigh eagarthóireacht agus léamh tabbed i Word, Excel, PowerPoint, Foilsitheoir, Rochtain, Visio agus Tionscadal.
  • Oscail agus cruthaigh cáipéisí iolracha i gcluaisíní nua den fhuinneog chéanna, seachas i bhfuinneoga nua.
  • Méadaíonn do tháirgiúlacht 50%, agus laghdaíonn sé na céadta cad a tharlaíonn nuair luch duit gach lá!
Comments (23)
No ratings yet. Be the first to rate!
This comment was minimized by the moderator on the site
I have the same issue when graphing data that has date AND time: points on the graph are equally spaced, whereas the underlying data has unequal gaps between datapoints. Data is in the form "dd/mm/yyyy hh:mm" formatted as date/time (not text). Data spans multiple days so it's not possible to extract just the time element.
This comment was minimized by the moderator on the site
I have a chart with x-axis in time that stretches during about 6h and 35min. I have data for each 20min in the beginning, then 15min and lastly each 10min. Also, in between I have 45min and 5min data.. The issue that I have, and several others, is that each gap between the date are equally spaced out. Meaning that, even if it is only 5min the gap is the same as if it was 45min.
This comment was minimized by the moderator on the site
i want to make a line graph which contains thousand of entries it's included date, time, month and year, so please help me out.
This comment was minimized by the moderator on the site
Hi, syed Mubashir alam, I do not understand your quetion, if you just create a line graph and the x-axis contains month/day/year hour:minute as below screenshot shown:
https://www.extendoffice.com/images/stories/comments/sun-comment/line-chart-1.png
just follow above steps of the article. If your question is about the axis contents are to long, there is no good idea.
This comment was minimized by the moderator on the site
i want to make a line graph which contains thousands of entries including time, date, month and year but i couldn't make a line graph so please help me out.
This comment was minimized by the moderator on the site
It's good coment that point is not a comma. When you want to add more numericals numbers you should use comma in excel ;)
This comment was minimized by the moderator on the site
Excel menus have changed - this is an out of date article - please update for 2020 .. e.g where is AXIS TYPE now?
This comment was minimized by the moderator on the site
I did not found Excel 2020, just 365 2019, which menus are the same as 2013,2016 version.
This comment was minimized by the moderator on the site
How do I remove days that don't have data in them. Example 8/1-8/31 but not data was captured on 8/3 or 8/4, how do I remove those dates from my graph? They are not in my data table so why is it pulling them?
This comment was minimized by the moderator on the site
Open the Excel file that holds the chart from which you want to exclude dates. Click the X-axis, located underneath the chart, so that it becomes surrounded by a small box. Right-click inside the box and choose "Format Axis" from the popup menu. Click "Axis Options" on the left side of the "Format Axis" window. Locate the three "Axis Type" options in the middle of the screen on the right side of the window. Click the radio button next to "Text axis."
This comment was minimized by the moderator on the site
Hi, I have an issue here. When I opened "Format Axis" and "Axis Options", there is no "Axis Type" choice here
This comment was minimized by the moderator on the site
Hi, Agassi, which Excel version you use?
This comment was minimized by the moderator on the site
Easy, useful, but i didn't know. Thanks a lot
This comment was minimized by the moderator on the site
But it doesnt show them in right relation to eachother. For example 2 hours and 6 hours are same in chart..
This comment was minimized by the moderator on the site
Hi Kiwi, maybe you can paint a chart to show me what you want the chart show.
There are no comments posted here yet
Load More
Please leave your comments in English
Posting as Guest
×
Rate this post:
0   Characters
Suggested Locations